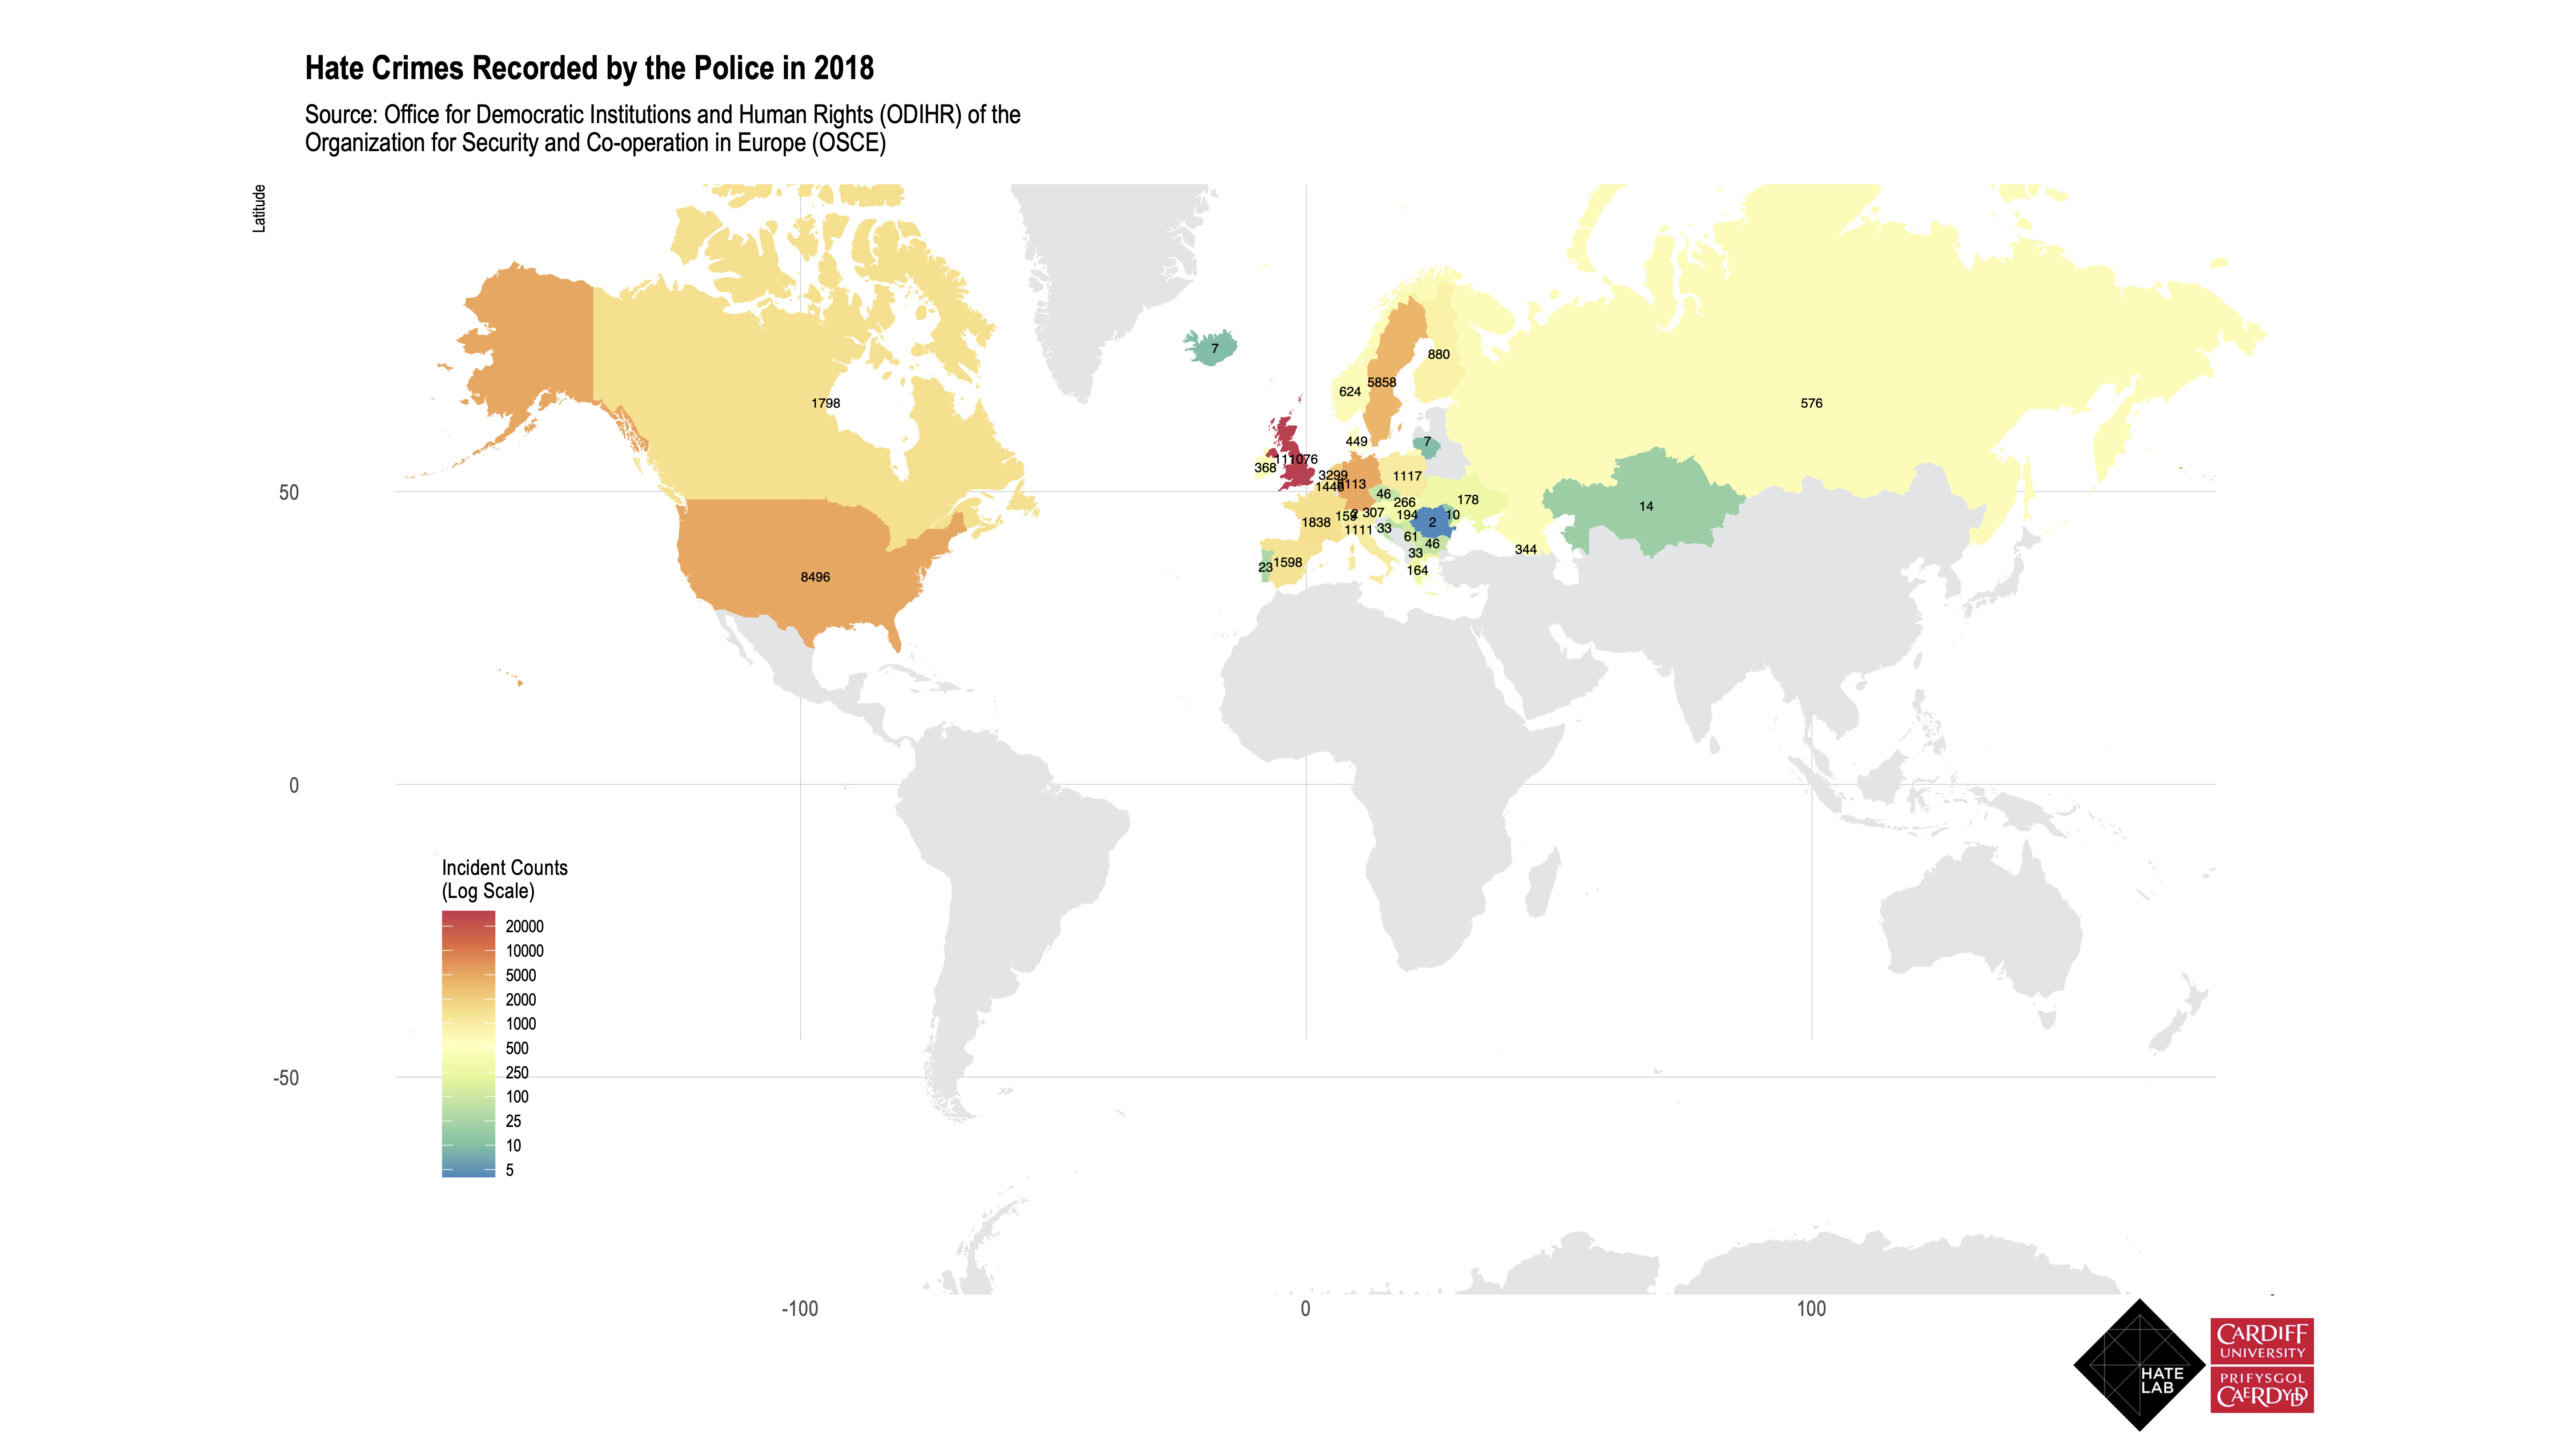
This world choropleth shows the number of police recorded hate crimes in 2018 (for 2019 data see here) across countries that report into the Office for Democratic Institutions and Human Rights (ODIHR). Colours of countries indicate the frequency of hate crimes, with cooler shades of purple, green and blue indicating low levels, and warmer shades of yellow, orange and red indicating high levels. The UK, one of the smaller countries on the map is shaded a deep red, indicating the highest count of hate crimes recorded to the police globally. This visualisation is more a representation of competing hate crime definitions, police practice, victim behaviour and the differences in how statistics are collected globally, than of actual differences in perpetration. For example, in the UK these data include hate crimes covering race, religion, sexual orientation, disability, and transgender status. Not all countries recognise hate crimes in all these categories.
See the cartogram for another view of theses global hate crime data.
Note: Data for UK includes England & Wales, Northern Ireland and Scotland.